

For Your Information
1. PUT IT ON THE CARD – Credit card debt in the USA was $103 trillion as of February 2018, its highest level ever. Credit card debt was $1.02 trillion in May 2008. (source: Federal Reserve).
2. NOT THAT MANY – A study released on March 22, 2018, estimates that only 4 percent of personal bankruptcies are “associated with a prior hospital admission.” (Source: Myth and Measurement – The Case of Medical Bankruptcies)
3. TOTAL FEDERAL DEBT – The United States did not reach a national debt of $12.4 TRILLION until February 18, 2010, 221 years after our government began keeping financial records in 1789. (Source: Treasury Department)
4. TOP 5 AND THE REST – The top 5 percent of US taxpayers (based upon adjusted gross income) paid more federal income tax ($866 Billion) during the 2015 tax year (the latest year that tax information has been released) than the federal income tax paid ($588 Billion) by the bottom 95 percent of taxpayers. 141 million tax returns were filed for the 2015 tax year. (Source: Internal Revenue Service)
5. I BET YOU ARE THE PAYING HALF – Half of the taxpayers pay 97.2 percent of all income taxes. (Source: IRS, Statistics of Income, Individual Income Rates and Tax Shares 2017)
6. BIG MONEY TODAY – Patrick Reed pocketed $1.98 million for winning the 2018 Masters. Arnold Palmer won $1.86 million during his 62 win PGA career. (Source: PGA)
This Week’s Economic News — But, First…
This weekend millions of Americans and/or their accountants are preparing to file income tax returns. Tax day is an annual event as significant as the Fourth of July — though it is far less fun! You may ask whose bearing the most burden under our new tax law. Well if you guessed the Top 1 percent, you are correct. The Top 1 percent go from paying 38 percent of total income taxes to a little over 43 percent!
Here’s how it breaks down:
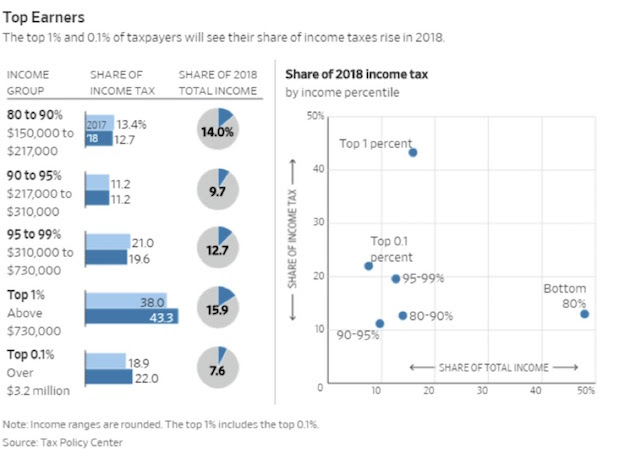
For 2018, households in the top 20 percent will have incomes of about $150,000 or more and 52 percent of total income, about the same as in 2017. But they will pay about 87 percent of the income taxes, up from about 84 percent last year. I bet you are feeling rich, right?
And we can thank Congress for finding a way to pay for the “tax cuts” for the lower income tiers who do benefit from the “RICH” paying more. Congress wanted to help us so they found more revenue by taking away deductions. Let’s not get you more depressed. However, this cute infographic from Bloomberg illustrates the problem in Washington. No one really knows what’s going on.

The stock market bounced back this past week as concerns about a possible trade war with China faded after several U.S. officials, including Treasury Secretary Steven Mnuchin, and Chinese President Xi Jinping downplayed talk of a retaliatory trade war. In fact, Xi Jinping stated in a speech at the Boao Forum on Tuesday that he “plans to significantly cut tariffs on imported automobiles, reduce duties on other imported goods, and improve the intellectual property rights of foreign firms.” Fears of a trade war with China were then replaced with rising geopolitical tension between the U.S. and Russia.
A suspected chemical attack from the Russian-supported Syrian government on the rebel-held town of Douma, Syria on April 7th brought strong condemnation and threats of a retaliatory strike against Syria from the U.S., Great Britain, and France. Russia replied last Wednesday that it would shoot down any missiles fired at Syria prompting President Trump to state “get ready Russia because they will be coming.” And come they did late Friday evening when a military coalition from the U.S., Great Britain, and France struck several chemical weapons sites in Syria. As a result, we will likely see a sharp increase in volatility this week in the financial markets with the rising tensions between Russia and coalition forces and the uncertainty that comes from military action in Syria.
The week’s economic reports took a back seat to geopolitical news, receiving a muted response from investors. Minutes from the Fed’s March FOMC meeting were released containing no surprises. The latest round of inflation data from the March Producer Price Index (PPI) and Consumer Price Index (CPI) reports revealed a stiffening inflation trend with the PPI rising +0.3% while the core CPI advanced 0.2% for the month. This will keep the Fed on the plan to raise rates at least two more times this year with the next 25 basis point hike likely to occur at the June FOMC meeting with a probability of 95.0%.
According to the latest data from the Mortgage Bankers Association’s (MBA) weekly mortgage applications survey, there was a decline in mortgage applications. The MBA reported their overall seasonally adjusted Market Composite Index (application volume) decreased by 1.9% during the week ended April 6, 2018. The seasonally adjusted Purchase Index decreased by 2.0% from the week prior while the Refinance Index also decreased by 2.0%.
Overall, the refinance portion of mortgage activity fell to 38.4% from 38.5% of total applications from the prior week, its lowest level since September 2008. The adjustable-rate mortgage share of activity fell to 6.3% from 6.5% of total applications. According to the MBA, the average contract interest rate for 30-year fixed-rate mortgages with a conforming loan balance fell to 4.66% from 4.69% with points increasing to 0.46 from 0.43.
For the week, the FNMA 4.0% coupon bond fell 32.8 basis points to close at $102.266 while the 10-year Treasury yield increased 4.95 basis points to end at 2.8248%. The major stock indexes moved higher during the week.
The Dow Jones Industrial Average gained 427.38 points to close at 24,360.14. The NASDAQ Composite Index advanced 191.54 points to close at 7,106.65. The S&P 500 Index added 51.83 points to close at 2,656.30. Year to date on a total return basis, the Dow Jones Industrial Average has fallen 3.18%, the NASDAQ Composite Index has gained 0.17%, and the S&P 500 Index has lost 2.59%.
This past week, the national average 30-year mortgage rate increased to 4.50% from 4.48%; the 15-year mortgage rate rose to 3.89% from 3.86%; the 5/1 ARM mortgage rate increased to 3.68% from 3.65% while the FHA 30-year rate was unchanged at 4.25%. Jumbo 30-year rates rose to 4.51% from 4.50%.
Following is how the rest of the week looks like like with regards to the pertinent economic news:
Monday
- Retail Sales
- Retail Sales excluding automobiles and light trucks
- New York Empire State Manufacturing Index -The Empire State Manufacturing Survey, which shows the health of the manufacturing sector in the NY region, was reported at 15.8 for the month of April, which was weaker than expectations of 18.2 and the prior report of 22.5. The decline is largely in part due to concerns around trade wars and increased tariffs.
- Business Inventories
- NAHB Housing Market Index – The NAHB Housing Market Index for the month of April was reported at 69. This was 1 point below both last month’s figure and expectations of 70. This is still a very strong figure. Buyer traffic remained at 51, which shows that demand is still strong.
- Net Long-Term TIC Flows
Tuesday
- Housing Starts – The market expects 1,268K, prior 1,236K
- Building Permits – The market expects 1,315K, prior 1,298K
- Industrial Production – The market expects 10.3%, prior 1.1%
- Capacity Utilization – The market expects 77.8%, prior 78.1%
Wednesday
- MBS Mortgage Applications Index
- Crude Oil Inventories – The market expects -0.189M, prior +3.306M
- Beige Book
Thursday
- Initial Jobless Claims – Market expects 226,000, prior 233,000
- Continuing Jobless Claims
- Philadelphia Fed Manufacturing Index – The market expects 21.0, prior 22.3
- Index of Leading Economic Indicators – The market expects 0.4%, prior 0.6%
Mortgage Rate Forecast
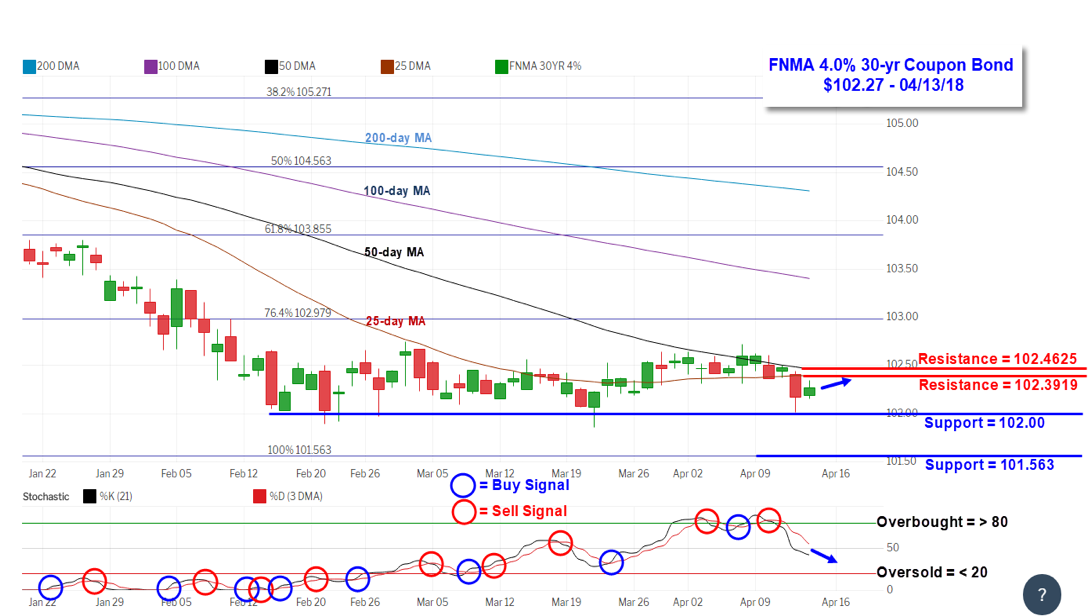
The FNMA 30-year 4.0% coupon bond ($102.27, -32.8 bp) traded within a wider 60.9 basis point range between a weekly intraday high of $102.625 on Monday and a weekly intraday low of $102.016 on Thursday before closing the week at $102.266 on Friday.
Mortgage bonds lost ground during the week as the stock market advanced and failed to remain above a declining 50-day moving average while also falling below the 25-day moving average. These two moving averages now form a tight band of overhead resistance. However, Friday’s trading resulted in a potentially bullish two-day Harami candlestick pattern signaling a possible change in market direction higher that will require confirmation on Monday with a positive candlestick with a higher closing price.
With a coalition of U.S., Great Britain, and French military forces striking chemical weapons installations in Syria late Friday evening to significantly increase geopolitical tensions with Syrian ally Russia, we will likely see increased volatility in the stock and crude oil markets with investors moving money from stocks into bonds in a “flight to safety” trade. If this anticipated reaction is strong enough, it would be bullish for mortgage bonds and would perhaps send prices above both resistance levels resulting in a slight improvement in mortgage rates this coming week.
Jim’s Rate Lock Recommendation
LOCK if closing in 7 days
LOCK if closing in 15 days
LOCK if closing in 30 days
FLOAT if closing in 45 days
FLOAT if closing in 60 days