The stock market turned in a mixed performance for the second consecutive week as investors pulled back from record highs reached during the prior week amid trade and political turmoil. The Dow and S&P 500 both posted small losses while the NASDAQ Composite Index recorded a moderate gain. Treasury and mortgage bond yields ended the week slightly lower after retreating on Wednesday following the Federal Reserve’s monetary policy meeting. The drop in bond yields were partly due to dovish comments on inflation made by Fed Chairman Jerome Powell following the policy meeting.
As widely expected, the Federal Reserve increased short-term interest rates, bumping up the fed funds target range by 25 basis points to 2.00-2.25%. In the accompanying policy statement, the Fed removed the word “accommodative”, leading some analysts to believe Fed officials could be leaning toward slowing the pace and number of rate hikes. However, Fed Chairman Powell commented during his press conference that the language change wasn't a signal for a change in the Fed's assessment of rate hikes. The Fed still appears to be planning to raise rates another 25 basis points in December with the latest Fed Funds Futures contract showing a probability of 76.5%. Looking ahead to next year, the Fed's latest dot plot shows expectations for three rate hikes in 2019 and one in 2020.
In housing news, the Federal Housing Finance Agency (FHFA) released their FHFA House Price Index (HPI) on Tuesday showing a 0.2% increase in U.S. house prices in July from the prior June reading. From July 2017 to July 2018, house prices were 6.4% higher. For the nine census divisions, seasonally adjusted monthly price changes from June 2018 to July 2018 ranged from a -0.5% in the East South Central division to 1.1% in the South Atlantic division. The 12-month changes were all positive, ranging from 4.7% in the New England division to 8.7% in the Mountain division.
This Week's Market Report Content
Random But Uncannily Popular Questions
Is being late to a meeting a power move?
Would you sacrifice yourself to save a stranger?
Do you typically put your head underwater when you go swimming?
Do you hold hands with your spouse/partner in public?
Have you ever tried to solve cold cases on your own?
Did you pass your driver's test on the first try?
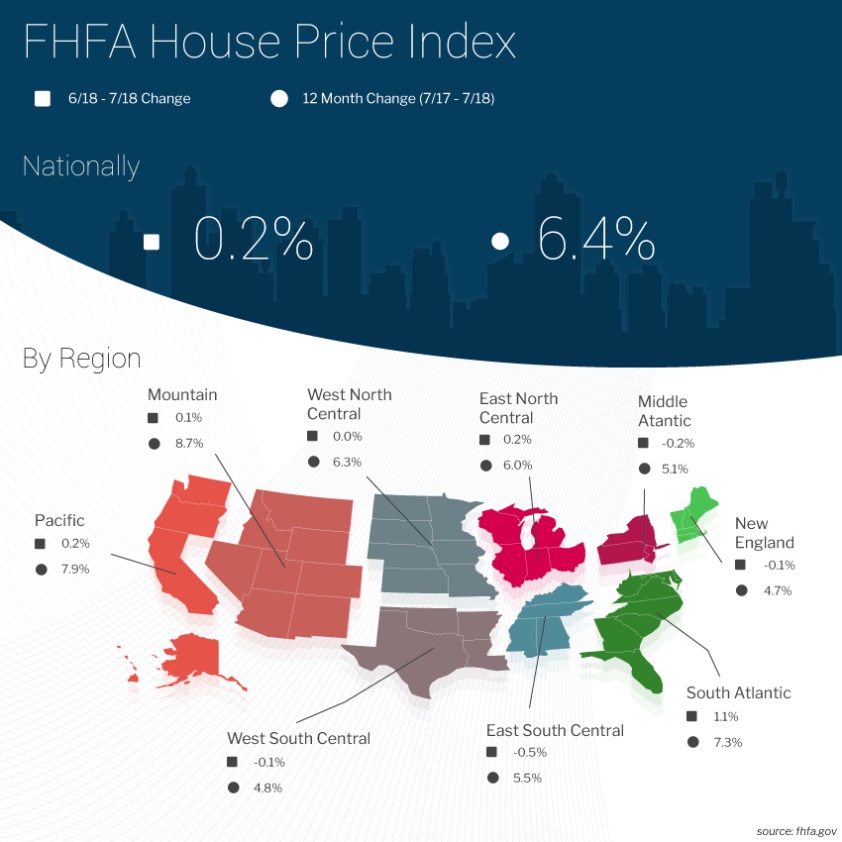
The previously reported 0.2% increase in June was revised upward to 0.3%.
Also last Tuesday, the S&P Dow Jones Indices released their latest results for the S&P CoreLogic Case-Shiller Indices, the leading measure of U.S. home prices. Data released for July 2018 showed home prices continued to rise across the country over the last 12 months with a 6.0% annual gain in July, down from 6.2% in the previous month.
The 10-City Composite annual increase came in at 5.5%, down from 6.0% in the previous month. The 20-City Composite recorded a 5.9% year-over-year gain, down from 6.4% in the previous month.
Las Vegas, Seattle, and San Francisco continued to report the highest year-over-year gains among the 20 cities. In July, Las Vegas led the way with a 13.7% year-over-year price increase, followed by Seattle with a 12.1% increase and San Francisco with a 10.8% increase. Five of the 20 cities reported greater price increases in the year ending July 2018 versus the year ending June 2018.
David M. Blitzer, Managing Director and Chairman of the Index Committee at S&P Dow Jones Indices, had this to say "Rising homes prices are beginning to catch up with housing. Year-over-year gains and monthly seasonally adjusted increases both slowed in July for the S&P CoreLogic Case-Shiller National Index and the 10 and 20-City Composite indices.
The slowing is widespread: 15 of 20 cities saw smaller monthly increases in July 2018 than in July 2017. Sales of existing single-family homes have dropped each month for the last six months and are now at the level of July 2016. Housing starts rose in August due to strong gains in multifamily construction. The index of housing affordability has worsened substantially since the start of the year.”
Wednesday, the Census Bureau released their New Home Sales report for August showing an increase in sales of 3.5% to a seasonally adjusted annual rate of 629,000. This just missed the consensus estimate of 630,000, plus July’s sales number was downwardly revised to 608,000 from 627,000. Regionally, new home sales in the Northeast jumped 47.8% to 34,000; rose 2.7% in the Midwest to 77,000; and increased 9.1% in the West to 168,000. Sales in the Southern region, the largest market for new home sales, fell 1.7% month-over-month to 350,000.
This Week's Economic News
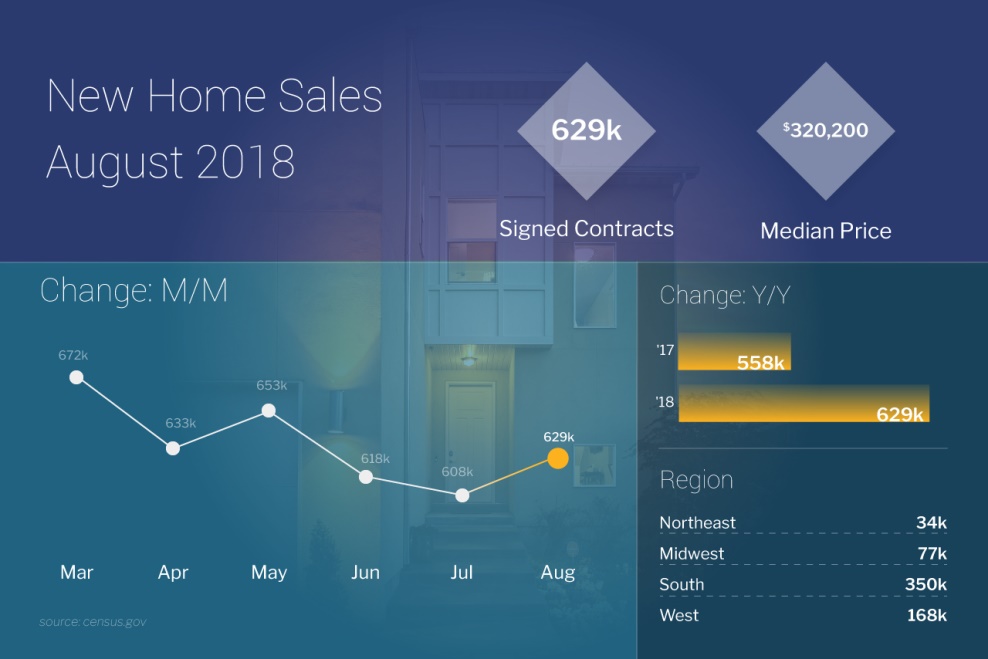
Homes priced at $399,999 or less accounted for 67% of new homes sold versus 70% in July, possibly indicating supply constraints at the lower end of the new home market.
The average sales price climbed 5.2% year-over-year to $388,400 while the median sales price was up 1.9% year-over-year to $320,200. The supply of new homes for sale is at a 6.1-months' supply at the August sales rate versus 6.0 months a year ago. This data reflects the affordability constraints that are increasing right along with rising home prices and mortgage rates.
Thursday, the National Association of Realtors (NAR) released a summary of Pending Home Sales showing August’s sales rate was 1.8% lower than in July and were 2.3% lower from a year ago.
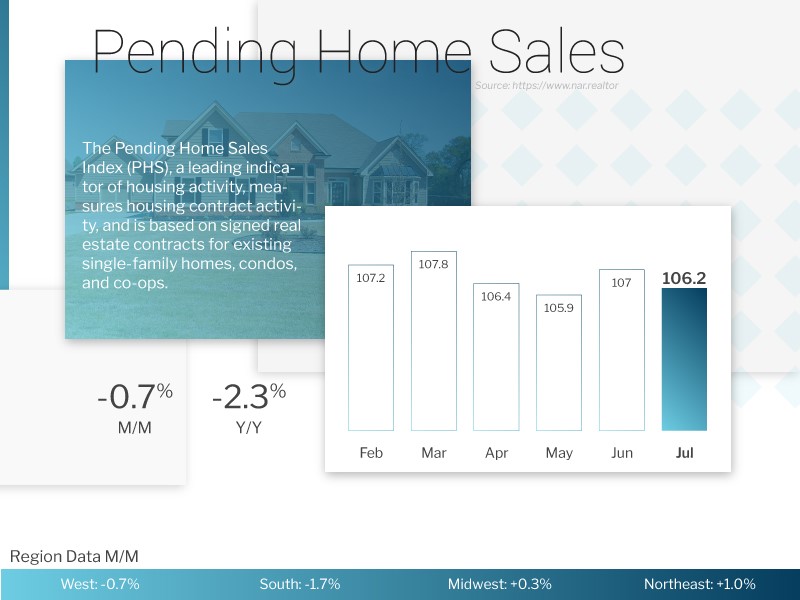
Pending Sales represent homes that have a signed contract to purchase on them but have yet to close. They tend to lead existing-home sales data by one to two months.
Three of the nation’s four regions showed declines from a year ago. The South had the only increase in pending sales of 1.3% while the West showed a significant drop in sales of 11.3%. The Northeast fell 1.6% followed by the Midwest with a decline of 1.1%. The U.S. pending home sales index level for the month was 104.2. July’s data was revised higher to 106.1. Despite August’s decline, this is the pending index’s 52nd consecutive month over the 100 level. The 100 level is based on a 2001 benchmark and is consistent with a healthy market and existing-home sales above the five million mark.
Elsewhere, the latest data from the Mortgage Bankers Association’s (MBA) weekly mortgage applications survey showed an increase in mortgage applications. The Mortgage Bankers Association reported their overall seasonally adjusted Market Composite Index (application volume) rose 2.9% during the week ended September 21, 2018. The seasonally adjusted Purchase Index increased 3.0% from the week prior as did the Refinance Index.
Overall, the refinance portion of mortgage activity increased to 39.4% from 39.0% of total applications from the prior week. The adjustable-rate mortgage share of activity remained unchanged at 6.5% of total applications. According to the MBA, the average contract interest rate for 30-year fixed-rate mortgages with a conforming loan balance increased to 4.97% from 4.88%, its highest level since April 2011, with points increasing to 0.47 from 0.44 for 80 percent loan-to-value ratio (LTV) loans.
For the week, the FNMA 4.0% coupon bond gained 6.2 basis points to close at $100.906 while the 10-year Treasury yield decreased 0.30 of one basis point to end at 3.065%. The Dow Jones Industrial Average fell 285.19 points to close at 26,458.31. The NASDAQ Composite Index gained 59.39 points to close at 8,046.35. The S&P 500 Index lost 15.69 points to close at 2,913.98. Year to date on a total return basis, the Dow Jones Industrial Average has gained 7.04%, the NASDAQ Composite Index has advanced 16.56%, and the S&P 500 Index has added 8.99%.
This past week, the national average 30-year mortgage rate fell to 4.78% from 4.85%; the 15-year mortgage rate decreased to 4.26% from 4.30%; the 5/1 ARM mortgage rate dropped to 3.95% from 4.05% while the FHA 30-year rate decreased to 4.37% from 4.48%. Jumbo 30-year rates decreased to 4.32% from 4.40%.
Mortgage Rate Forecast - FNMA 30-Year 4.0% Coupon Bond
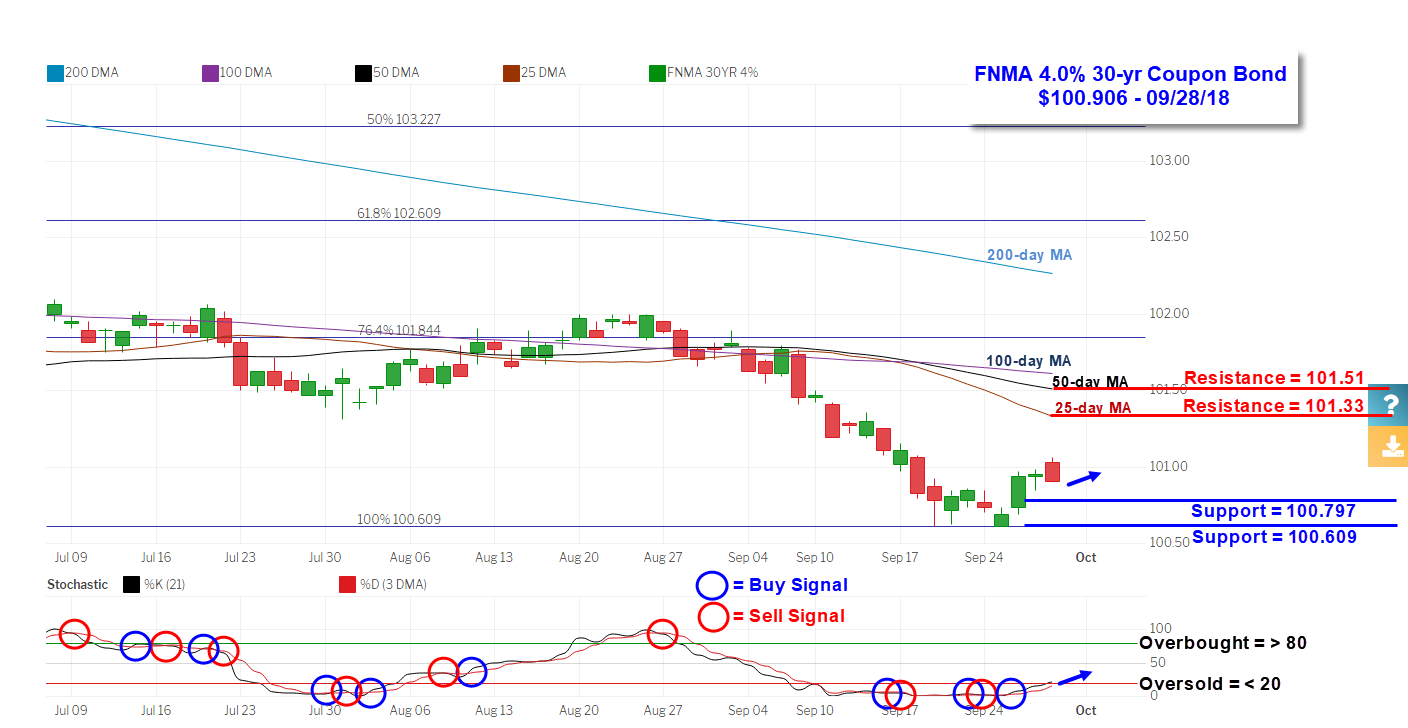
The FNMA 30-year 4.0% coupon bond ($100.906, 6.20 bp) traded within a narrower 45.4 basis point range between a weekly intraday high of 101.063 on Friday and a weekly intraday low of $100.609 on Tuesday before closing the week at $100.906 on Friday. Mortgage bond prices took a dip lower on Monday and Tuesday before bouncing higher off of technical support levels the remainder of the week. The bond remains “oversold” while still operating on a buy signal from last Wednesday so we could see an extension higher in price toward resistance at $101.33. A continuation higher toward technical resistance should result in stable to very slightly lower mortgage rates.
JIM'S RATE LOCK RECOMMENDATION
Rate lock or float recommendations are different for every loan. These are general recommendations and do not constitute a guarantee on what is right for your loan. Please consult with your mortgage professional.
Are you ready to purchase or refinance a home? Let me help you, call Jim Catalano at 214-770-1499 or complete my online form below:

